
State bird
Eastern goldfinch (American goldfinch)
Sources: Designation & background

The Hawkeye State
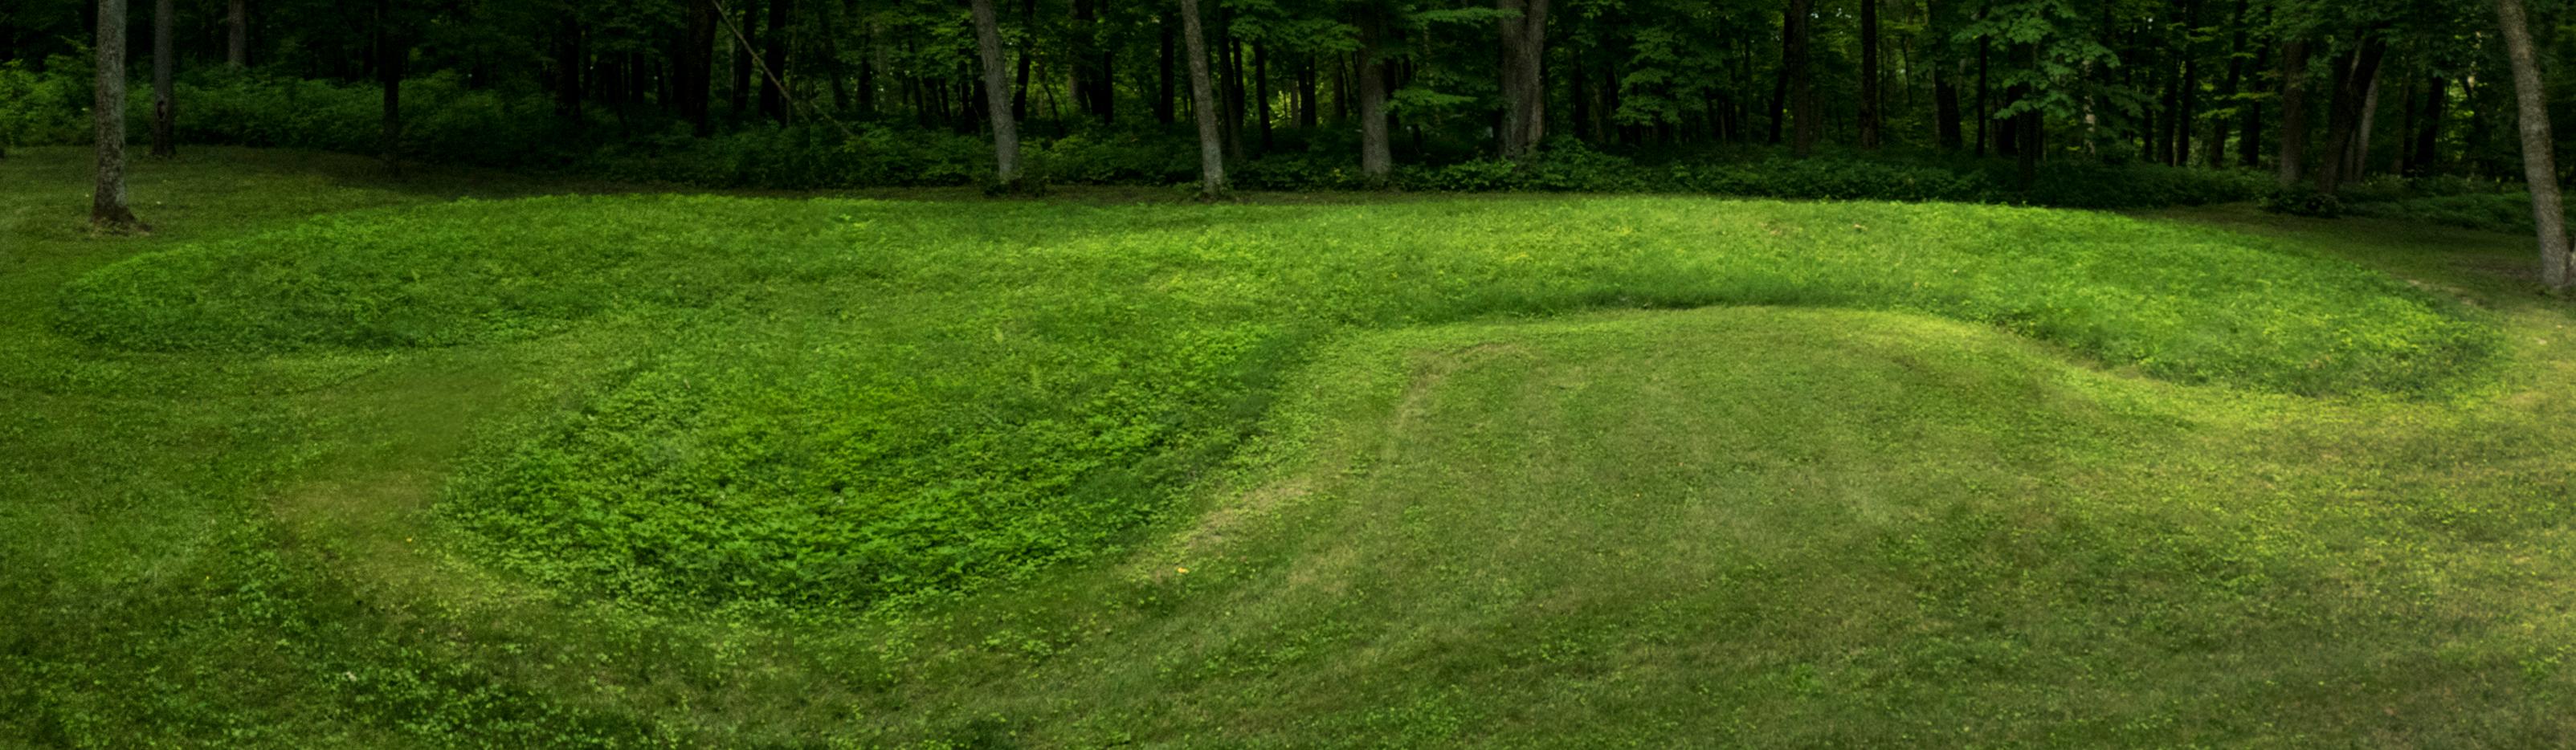
The monument’s mounds occupy bluffs and other sites near the Mississippi River.
Sources: Census · population · Census · area
Eastern goldfinch (American goldfinch)
Sources: Designation & background
The Song of Iowa
Sources: Designation & background
Neighboring states: Illinois, Minnesota, Missouri, Nebraska, South Dakota, Wisconsin.
The monument’s mounds occupy bluffs and other sites near the Mississippi River. River corridors offered access to water, food and travel routes, and the elevated terrain gave views across the surrounding landscape.
The total area includes 144,669 km² of land and 1,077 km² of water, according to Census area measurements.
Blue, white and red vertical bands, with an eagle and ribbon in the center and Iowa below.
Sources: Census · geographic reference · Census · area measurements · National Park Service · Effigy Mounds
The Mississippi River corridor helps explain why the Effigy Mounds landscape mattered to people. A river offers water, food resources, and routes for travel; nearby bluffs provide a different setting above the water. Mounds are cultural features, not simply unusual natural hills. Reading the land requires recognizing both natural processes and deliberate human construction.
Long before Iowa became a U.S. state, Indigenous communities built earthworks along the Upper Mississippi River. Some were shaped like birds or bears; others were round or linear. These were constructed places with ceremonial and, in many cases, burial functions, not natural hills.
Effigy Mounds National Monument protects more than 200 mounds in northeastern Iowa. Associated tribal communities regard these places as sacred. Archaeology can document their construction and setting, but not every purpose is known with certainty. Understanding the mounds places Iowa’s history in a much longer timespan than the Louisiana Purchase and nineteenth-century settlement.
Read more: Historical source ↗
Effigy mounds were built by Indigenous communities long before Iowa statehood. Some take the shapes of animals. Their meaning cannot be reduced to a modern tourist landmark or treated as evidence of a people with no living descendants. The National Park Service works with affiliated tribes because these places remain culturally significant.
Sources: Congressional Research Service · statehood · U.S. Census Bureau · historical geography · National Park Service
The Meskwaki Nation maintains a living community in Iowa. Its own history and cultural resources provide an essential counterpoint to learning about Indigenous Iowa only through ancient mounds.
Continue with Meskwaki Nation. This is one starting point, not a complete account of the peoples connected to this land.
| Measure | Iowa | Illinois |
|---|---|---|
| Population (2025) | 3,238,387 | 12,719,141 |
| Land area (km²) | 144,669 | 143,793 |
| People per km² of land | 22.4 | 88.5 |
Illinois has more people per square kilometer of land. Population density divides population by land area. It is an average across the whole jurisdiction, not a claim that residents are evenly spread out.
Calculated from the Census population series and land-area measurements used on these pages. Rounded figures; water area is excluded. Explore Illinois.
In 2025, manufacturing was the largest of the broad industry groups compared here by current-dollar output. Other major groups included finance and insurance, government and government enterprises, and real estate and rental and leasing.
Total economic output was $277.1 billion in current dollars in 2025.
Share of total current-dollar GDP. These figures measure output, not employment.
Sources: BEA · annual GDP by state, SAGDP2
The industry chart measures the value of production. It does not count workers. An industry with a large share of GDP need not employ the most people or pay the highest wages. Employment and wage data would be needed to answer those questions.
July 1 resident population estimates, using the Census Bureau’s Vintage 2025 series.
Sources: U.S. Census Bureau
| Year | People |
|---|---|
| 2020 | 3,191,081 |
| 2021 | 3,199,037 |
| 2022 | 3,201,890 |
| 2023 | 3,214,739 |
| 2024 | 3,230,454 |
| 2025 | 3,238,387 |
Real GDP measures economic output adjusted for inflation. The chart uses BEA’s chained 2017 dollars.
Sources: U.S. Bureau of Economic Analysis
| Year | Millions of chained 2017 dollars |
|---|---|
| 2010 | 161,593.1 |
| 2011 | 164,559.3 |
| 2012 | 170,923.7 |
| 2013 | 171,069.1 |
| 2014 | 180,309.9 |
| 2015 | 185,989.2 |
| 2016 | 186,729.9 |
| 2017 | 187,125.0 |
| 2018 | 189,245.1 |
| 2019 | 188,471.4 |
| 2020 | 187,261.7 |
| 2021 | 202,470.6 |
| 2022 | 202,672.5 |
| 2023 | 201,359.8 |
| 2024 | 206,438.9 |
| 2025 | 208,842.3 |
Iowa’s population increased by about 1.5% between 2020 and 2025 in this series. That shows the size of the change. The chart alone cannot tell us how much came from births, deaths or migration.
Real GDP adjusts for changes in prices, so it helps compare production over time. Current-dollar GDP includes price changes. Neither measure tells us how income is distributed among residents.
Electoral votes equal the state’s U.S. House seats plus its two U.S. Senate seats. These allocations apply to the 2024 and 2028 presidential elections.
Use the explanations and data on this page to answer ten questions. Hints and links to the relevant sections are available throughout.
Your place in the quiz and best full-quiz score are saved on this device when browser storage is available.
Want to practice recognizing states? Try the mixed-state map quiz.
Narrative and quiz updated 5 October 2026. Statistical data prepared 27 September 2026. Population: Census Bureau Vintage 2025, July 1 estimates for 2020–2025. Real GDP: BEA annual state accounts, SAGDP9, millions of chained 2017 dollars; industry shares: SAGDP2, current dollars. Data downloaded 27 September 2026. Area measurements include land and water.
Sources: Census · population estimates · BEA · state GDP · Census · area measurements · Natural Earth · map data
The capital clock shows current local time. Statistical figures are dated estimates and may be revised.
Updated 29 October 2026. Statistics retain the dated series shown in the charts; these are not live figures. Sources are linked beside each topic.