
State bird
Mountain bluebird
Sources: Designation & background

The Gem State
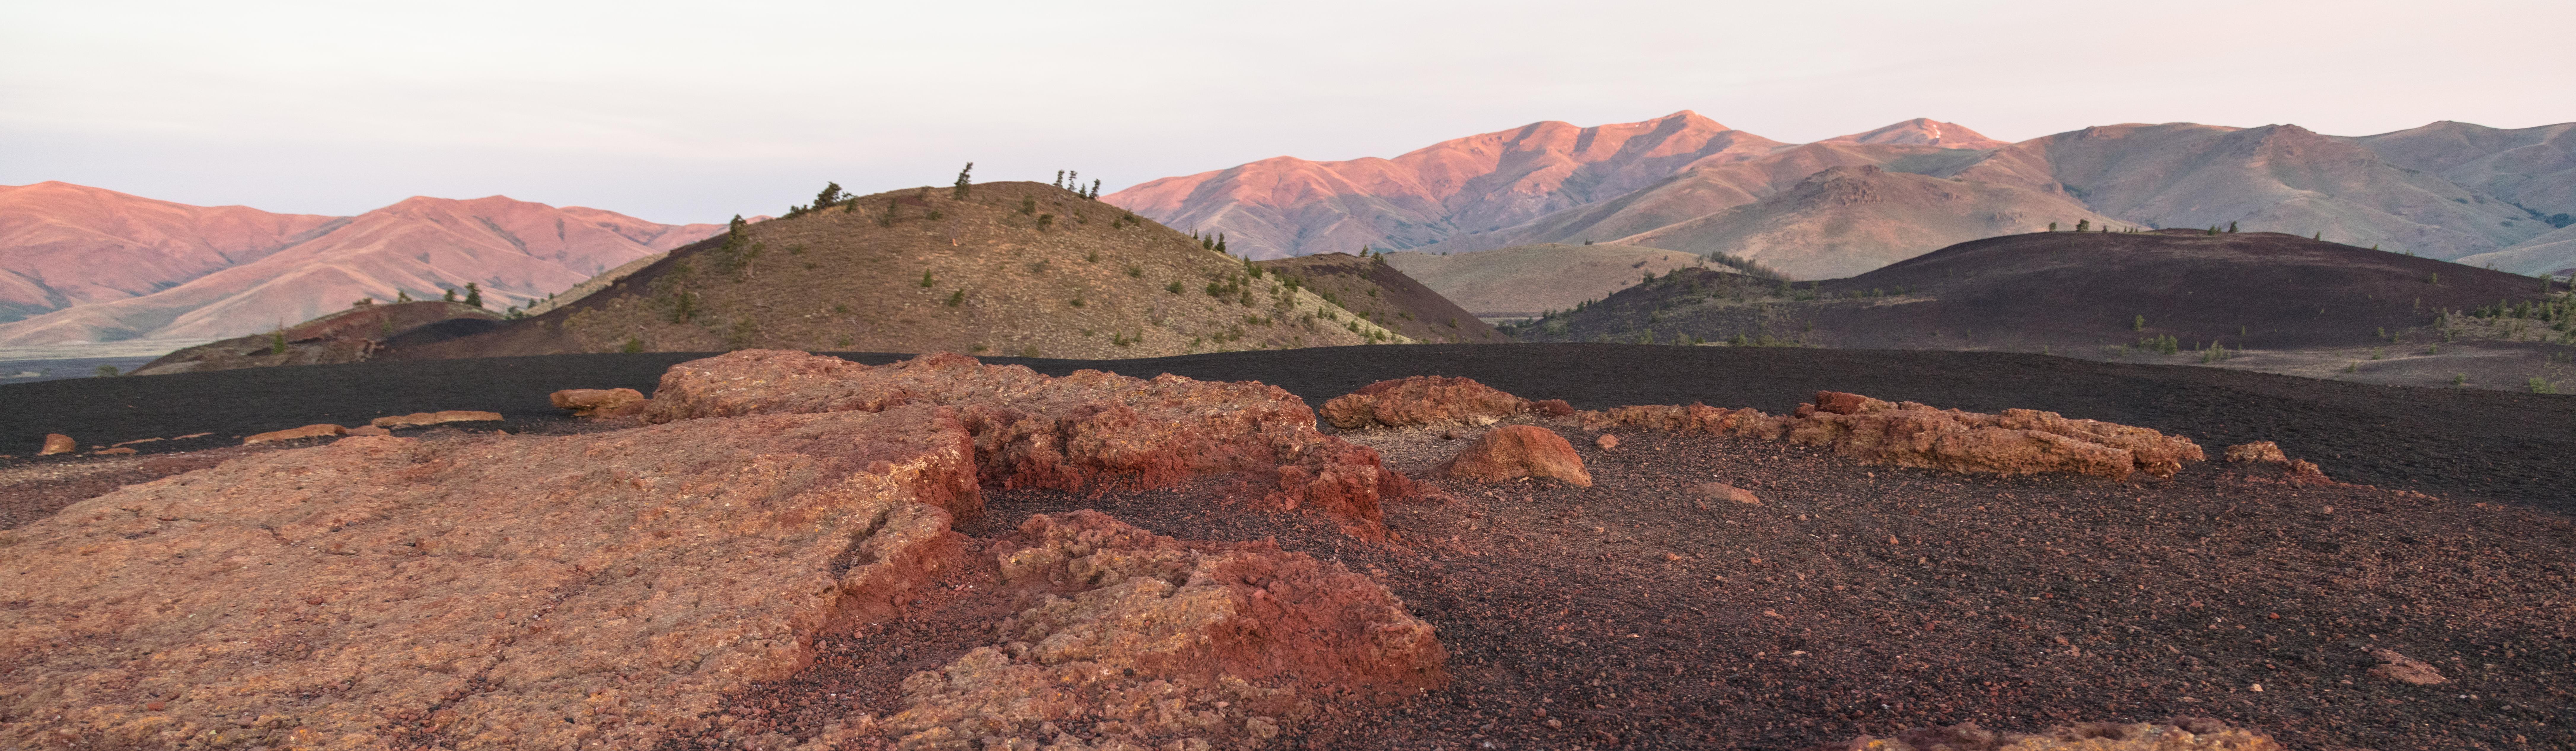
Craters of the Moon contains lava flows, cinder cones and areas of sagebrush between volcanic features.
Sources: Census · population · Census · area
Mountain bluebird
Sources: Designation & background
Here We Have Idaho
Sources: Designation & background
Potato
Sources: Designation & background
Neighboring states: Montana, Nevada, Oregon, Utah, Washington, Wyoming.
Craters of the Moon contains lava flows, cinder cones and areas of sagebrush between volcanic features. The landscape records repeated eruptions rather than a single impact crater, despite the name.
The total area includes 214,045 km² of land and 2,398 km² of water, according to Census area measurements.
The state seal on a blue field, with a red-and-gold State of Idaho ribbon below.
Sources: Census · geographic reference · Census · area measurements · National Park Service · Craters Of The Moon
At Craters of the Moon, lava flows and cinder cones are evidence of volcanic activity. The landscape’s name is a comparison with the Moon’s appearance, not proof of an impact from space. Sagebrush between volcanic features also reminds visitors that a volcanic landscape can contain living habitats. Names can provide a memory aid, but geological explanations require evidence about how landforms developed.
An 1855 treaty defined a Nez Perce reservation, but gold discoveries brought miners onto those lands. Instead of keeping the newcomers out, the U.S. government negotiated another treaty in 1863 that reduced the reservation to roughly one-tenth its earlier size. Bands whose homelands fell outside the new boundary refused to sign.
In 1877, the government ordered even those non-signing bands to move onto the smaller reservation. Violence and war followed. Nez Perce families fled through the region while pursued by the U.S. Army. The disagreement concerned whether some leaders could surrender lands belonging to other bands, not simply a refusal to honor an agreement everyone had accepted.
Read more: Historical source ↗
Gold discoveries increased pressure for access to Nez Perce lands. The 1863 treaty reduced the reservation established in 1855, but some bands did not accept the smaller boundaries. Calling the later conflict simply a refusal to move leaves out the disputed agreement and the land at stake. Different leaders’ signatures did not mean every community accepted the same terms.
Sources: Congressional Research Service · statehood · U.S. Census Bureau · historical geography · National Park Service
The Nez Perce Tribe’s present-day government and cultural work continue the history discussed in the treaty section. The events of 1877 should not become the last point at which learners encounter the nimíipuu.
Continue with Nez Perce Tribe. This is one starting point, not a complete account of the peoples connected to this land.
| Measure | Idaho | Montana |
|---|---|---|
| Population (2025) | 2,029,733 | 1,144,694 |
| Land area (km²) | 214,045 | 376,962 |
| People per km² of land | 9.5 | 3.0 |
Idaho has more people per square kilometer of land. Population density divides population by land area. It is an average across the whole jurisdiction, not a claim that residents are evenly spread out.
Calculated from the Census population series and land-area measurements used on these pages. Rounded figures; water area is excluded. Explore Montana.
In 2025, real estate and rental and leasing was the largest of the broad industry groups compared here by current-dollar output. Other major groups included professional and business services, government and government enterprises, and educational services, health care, and social assistance.
Total economic output was $135.6 billion in current dollars in 2025.
Share of total current-dollar GDP. These figures measure output, not employment.
Sources: BEA · annual GDP by state, SAGDP2
The industry chart measures the value of production. It does not count workers. An industry with a large share of GDP need not employ the most people or pay the highest wages. Employment and wage data would be needed to answer those questions.
July 1 resident population estimates, using the Census Bureau’s Vintage 2025 series.
Sources: U.S. Census Bureau
| Year | People |
|---|---|
| 2020 | 1,849,328 |
| 2021 | 1,904,855 |
| 2022 | 1,942,951 |
| 2023 | 1,970,497 |
| 2024 | 2,000,872 |
| 2025 | 2,029,733 |
Real GDP measures economic output adjusted for inflation. The chart uses BEA’s chained 2017 dollars.
Sources: U.S. Bureau of Economic Analysis
| Year | Millions of chained 2017 dollars |
|---|---|
| 2010 | 62,626.4 |
| 2011 | 62,704.0 |
| 2012 | 62,007.3 |
| 2013 | 64,769.8 |
| 2014 | 66,784.9 |
| 2015 | 67,790.5 |
| 2016 | 70,442.5 |
| 2017 | 72,935.1 |
| 2018 | 77,652.1 |
| 2019 | 81,144.3 |
| 2020 | 82,711.6 |
| 2021 | 88,955.2 |
| 2022 | 92,792.5 |
| 2023 | 95,286.5 |
| 2024 | 99,567.3 |
| 2025 | 101,567.6 |
Idaho’s population increased by about 9.8% between 2020 and 2025 in this series. That shows the size of the change. The chart alone cannot tell us how much came from births, deaths or migration.
Real GDP adjusts for changes in prices, so it helps compare production over time. Current-dollar GDP includes price changes. Neither measure tells us how income is distributed among residents.
Electoral votes equal the state’s U.S. House seats plus its two U.S. Senate seats. These allocations apply to the 2024 and 2028 presidential elections.
Use the explanations and data on this page to answer ten questions. Hints and links to the relevant sections are available throughout.
Your place in the quiz and best full-quiz score are saved on this device when browser storage is available.
Want to practice recognizing states? Try the mixed-state map quiz.
Narrative and quiz updated 5 October 2026. Statistical data prepared 27 September 2026. Population: Census Bureau Vintage 2025, July 1 estimates for 2020–2025. Real GDP: BEA annual state accounts, SAGDP9, millions of chained 2017 dollars; industry shares: SAGDP2, current dollars. Data downloaded 27 September 2026. Area measurements include land and water.
Sources: Census · population estimates · BEA · state GDP · Census · area measurements · Natural Earth · map data
The capital clock shows current local time. Statistical figures are dated estimates and may be revised.
Updated 29 October 2026. Statistics retain the dated series shown in the charts; these are not live figures. Sources are linked beside each topic.