
Sandhills
These are grass-covered sand dunes, not an expanse of bare desert. Water stored below ground supports lakes, wet meadows and streams. Sandy soils help explain why much of this landscape remains grazing land.

The Cornhusker State
Nebraska is a Great Plains state known for cattle ranching, farming and the grass-covered dunes of the Sandhills. Its history includes the 1854 debate over slavery, westward migration along the Platte River and the forced removal of the Ponca.

The 1854 slavery dispute and the 1867 voting-rights condition.
LAND & WATERGrasslands above an aquiferWhy the Sandhills support ranching and wetlands.
ONE CHAMBERA one-chamber legislatureWhy voters replaced the two-house system.
Sources: Census · population · Census · area
The Missouri River forms much of the eastern boundary. Six states border Nebraska: South Dakota, Iowa, Missouri, Kansas, Colorado and Wyoming.
These are grass-covered sand dunes, not an expanse of bare desert. Water stored below ground supports lakes, wet meadows and streams. Sandy soils help explain why much of this landscape remains grazing land.
Scotts Bluff stands beside the North Platte corridor. The bluff was a recognizable landmark for travelers on the Oregon, California and Mormon trails; the terrain also forced changes in wagon routes.
Along the northern edge of the Sandhills, the Niobrara cuts through a landscape where six major ecosystem types meet. Forests and different kinds of prairie coexist in a remarkably varied river valley.
The Niobrara River corridor brings different habitats together. River valleys can create conditions unlike the surrounding uplands through water, shelter, and changes in exposure. Scotts Bluff offers another view of Nebraska: a prominent landmark above the plains that mattered to travelers. Neither place supports the stereotype of a completely uniform, featureless landscape.
Scotts Bluff helped travelers on the Oregon, California and Mormon trails identify their position along the North Platte River route.
Photo: NPS / Eric Grunwald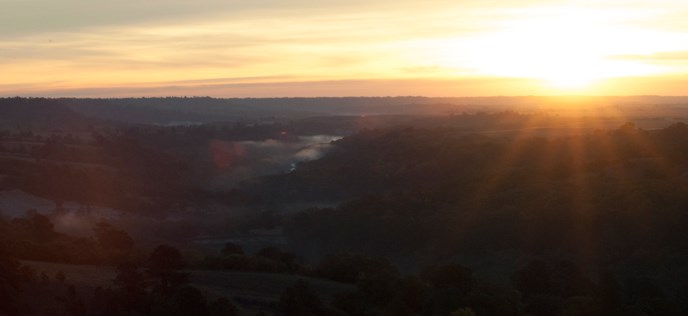
A meeting place for forests and prairies, with spring-fed waterfalls and steep valley sides.
Photo: NPS / Kristen Maxfield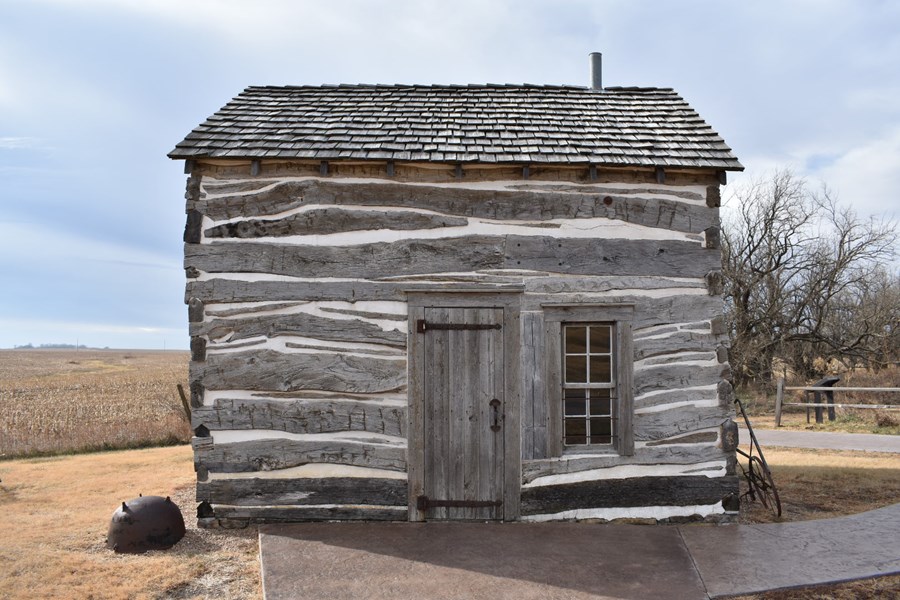
This park preserves the site of Daniel Freeman’s 1863 claim under the Homestead Act. The Palmer Cabin shown here was moved to the park; it was not Freeman’s home.
Photo: National Park ServiceNebraska Territory was created in 1854 through a deal over slavery and westward expansion. Nebraska became a state thirteen years later, after the Civil War, when Congress required it to allow Black men to vote.
As settlers moved west, Congress argued over whether slavery should be allowed in new territories. Under the Missouri Compromise of 1820, slavery was prohibited in the part of the Louisiana Purchase where Kansas and Nebraska would be organized.
Illinois senator Stephen Douglas wanted territorial governments established there to support settlement and a transcontinental railroad route through Chicago. He needed Southern votes to pass his bill. Powerful Southern senators demanded that the existing ban on slavery be repealed.
Douglas accepted that demand. The Kansas–Nebraska Act created the two territories and let their settlers decide whether to permit slavery, a policy called popular sovereignty. Land previously closed to slavery was now open to the possibility. The act became law on May 30, 1854.
U.S. Senate · the negotiations ↗ · National Archives · the law ↗
The Kansas-Nebraska Act organized territories in 1854; it did not admit two states. Allowing settlers to decide on slavery replaced an existing restriction and encouraged rival groups to compete for political control. Nebraska’s statehood in 1867 was a later event involving its own debate over voting rights. The two dates answer different questions.
Opponents of slavery saw the repeal as a broken promise. Proslavery and antislavery settlers rushed into Kansas to control its elections. The struggle became violent and was known as “Bleeding Kansas.” Opposition to the act also helped create the Republican Party. Douglas’s deal passed Congress, but it deepened the national division over slavery.
The act allowed eventual admission with or without slavery
. Neither territory became a state in 1854, and the law did not designate one as free and the other as slave.
The Ponca lived near the Missouri and Niobrara rivers long before Nebraska Territory existed. Territorial boundaries were imposed on a region already inhabited by Indigenous peoples.
Congress created Kansas and Nebraska territories and repealed the existing prohibition on slavery there.
The Homestead Act took effect on January 1. Daniel Freeman filed one of the first claims near Beatrice. Settlement opportunities existed alongside the loss of Indigenous land.
The proposed constitution limited voting to white men. Congress required Nebraska to remove the racial restriction, overrode President Andrew Johnson’s veto, and Nebraska accepted the condition. Statehood followed on March 1.
After the forced removal of the Ponca to Indian Territory, Standing Bear returned north. In 1879 a federal court in Omaha recognized his right to challenge detention through habeas corpus. The decision did not grant citizenship to all Native people.
Voters approved a unicameral system in 1934. It began operating in 1937, with nonpartisan legislative elections.
Congress restored recognition of the Ponca Tribe of Nebraska after federal termination in the 1960s. The tribe’s story continues in the present.
The 1925 banner design places Nebraska’s state seal in gold and silver on blue. The seal depicts nineteenth-century transportation, farming and industry.
The steamboat travels the Missouri; the train heads toward mountains in the west.
The blacksmith represents the mechanic arts. The cabin, wheat and corn depict settlement and farming.
The seal carries the date March 1, 1867.
The motto was adopted in 1867, the year Congress required Nebraska to remove the racial restriction on voting as a condition of statehood.
Nebraska Secretary of State · symbols ↗ · Nebraska State Historical Society · motto ↗
A state’s identity includes its cities, rural communities and tribal nations. These are three starting points, rather than a complete portrait.
Removal and federal termination did not end the Ponca community. The tribe’s own history traces the work to restore federal recognition and maintain a living political and cultural presence.
Cather’s formative years in and around Red Cloud shaped her fiction. Her writing offers another way into the prairie landscape and the lives of the people who settled there.
Black migration helped shape Omaha’s communities and musical life. Bandleader Dan Desdunes is one entry point into the city’s jazz history.
Western meadowlark
Sources: Designation & background
Beautiful Nebraska
Sources: Designation & background
The Omaha Tribe of Nebraska’s present-day government and community continue a history much older than territorial organization in 1854. Nebraska’s statehood story should be read alongside the histories of its Native nations.
Continue with Omaha Tribe of Nebraska. This is one starting point, not a complete account of the peoples connected to this land.
| Measure | Nebraska | Colorado |
|---|---|---|
| Population (2025) | 2,018,006 | 6,012,561 |
| Land area (km²) | 198,974 | 268,431 |
| People per km² of land | 10.1 | 22.4 |
Colorado has more people per square kilometer of land. Population density divides population by land area. It is an average across the whole jurisdiction, not a claim that residents are evenly spread out.
Calculated from the Census population series and land-area measurements used on these pages. Rounded figures; water area is excluded. Explore Colorado.
Ranching connects grasslands to the wider beef industry, but agriculture is only part of the state’s economy. The output figures below also show the importance of finance, insurance, manufacturing and public services. An industry’s GDP share measures value produced, not its share of jobs.
In 2025, finance and insurance was the largest of the broad industry groups compared here by current-dollar output. Other major groups included government and government enterprises, manufacturing, and real estate and rental and leasing.
Total economic output was $198.1 billion in current dollars in 2025.
Share of total current-dollar GDP. These figures measure output, not employment.
Sources: BEA · annual GDP by state, SAGDP2
The industry chart measures the value of production. It does not count workers. An industry with a large share of GDP need not employ the most people or pay the highest wages. Employment and wage data would be needed to answer those questions.
July 1 resident population estimates, using the Census Bureau’s Vintage 2025 series.
Sources: U.S. Census Bureau
| Year | People |
|---|---|
| 2020 | 1,963,318 |
| 2021 | 1,964,697 |
| 2022 | 1,972,595 |
| 2023 | 1,988,172 |
| 2024 | 2,005,591 |
| 2025 | 2,018,006 |
Real GDP measures economic output adjusted for inflation. The chart uses BEA’s chained 2017 dollars.
Sources: U.S. Bureau of Economic Analysis
| Year | Millions of chained 2017 dollars |
|---|---|
| 2010 | 103,940.8 |
| 2011 | 109,734.2 |
| 2012 | 109,686.3 |
| 2013 | 111,382.2 |
| 2014 | 115,651.9 |
| 2015 | 119,640.8 |
| 2016 | 121,303.1 |
| 2017 | 123,219.9 |
| 2018 | 125,543.4 |
| 2019 | 127,568.9 |
| 2020 | 126,711.2 |
| 2021 | 135,166.4 |
| 2022 | 139,878.1 |
| 2023 | 147,146.5 |
| 2024 | 148,102.8 |
| 2025 | 150,212.4 |
Nebraska’s population increased by about 2.8% between 2020 and 2025 in this series. That shows the size of the change. The chart alone cannot tell us how much came from births, deaths or migration.
Real GDP adjusts for changes in prices, so it helps compare production over time. Current-dollar GDP includes price changes. Neither measure tells us how income is distributed among residents.
Supporters led by George Norris argued that one chamber would make lawmaking easier to follow and reduce duplication. Nebraska voters approved the change in 1934. “Nonpartisan” means party labels are absent from legislative election ballots; it does not mean senators have no political affiliations.
Nebraska Legislature · how the system developed ↗
Electoral votes equal the state’s U.S. House seats plus its two U.S. Senate seats. These allocations apply to the 2024 and 2028 presidential elections. Nebraska awards two electoral votes to the statewide winner and one to the winner of each congressional district. Nebraska also has the only single-chamber state legislature: 49 senators elected on a nonpartisan basis.
Sources: National Archives · 2024 and 2028 electoral votes · Nebraska Legislature
Use the explanations and data on this page to answer ten questions. Hints and links to the relevant sections are available throughout.
Your place in the quiz and best full-quiz score are saved on this device when browser storage is available.
Want to practice recognizing states? Try the mixed-state map quiz.
Narrative and quiz updated 5 October 2026. Statistical data prepared 27 September 2026. Population: Census Bureau Vintage 2025, July 1 estimates for 2020–2025. Real GDP: BEA annual state accounts, SAGDP9, millions of chained 2017 dollars; industry shares: SAGDP2, current dollars. Data downloaded 27 September 2026. Area measurements include land and water.
Sources: Census · population estimates · BEA · state GDP · Census · area measurements · Natural Earth · map data
The capital clock shows current local time. Statistical figures are dated estimates and may be revised.
Updated 29 October 2026. Statistics retain the dated series shown in the charts; these are not live figures. Sources are linked beside each topic.