
State bird
Northern cardinal
Sources: Designation & background

The Buckeye State
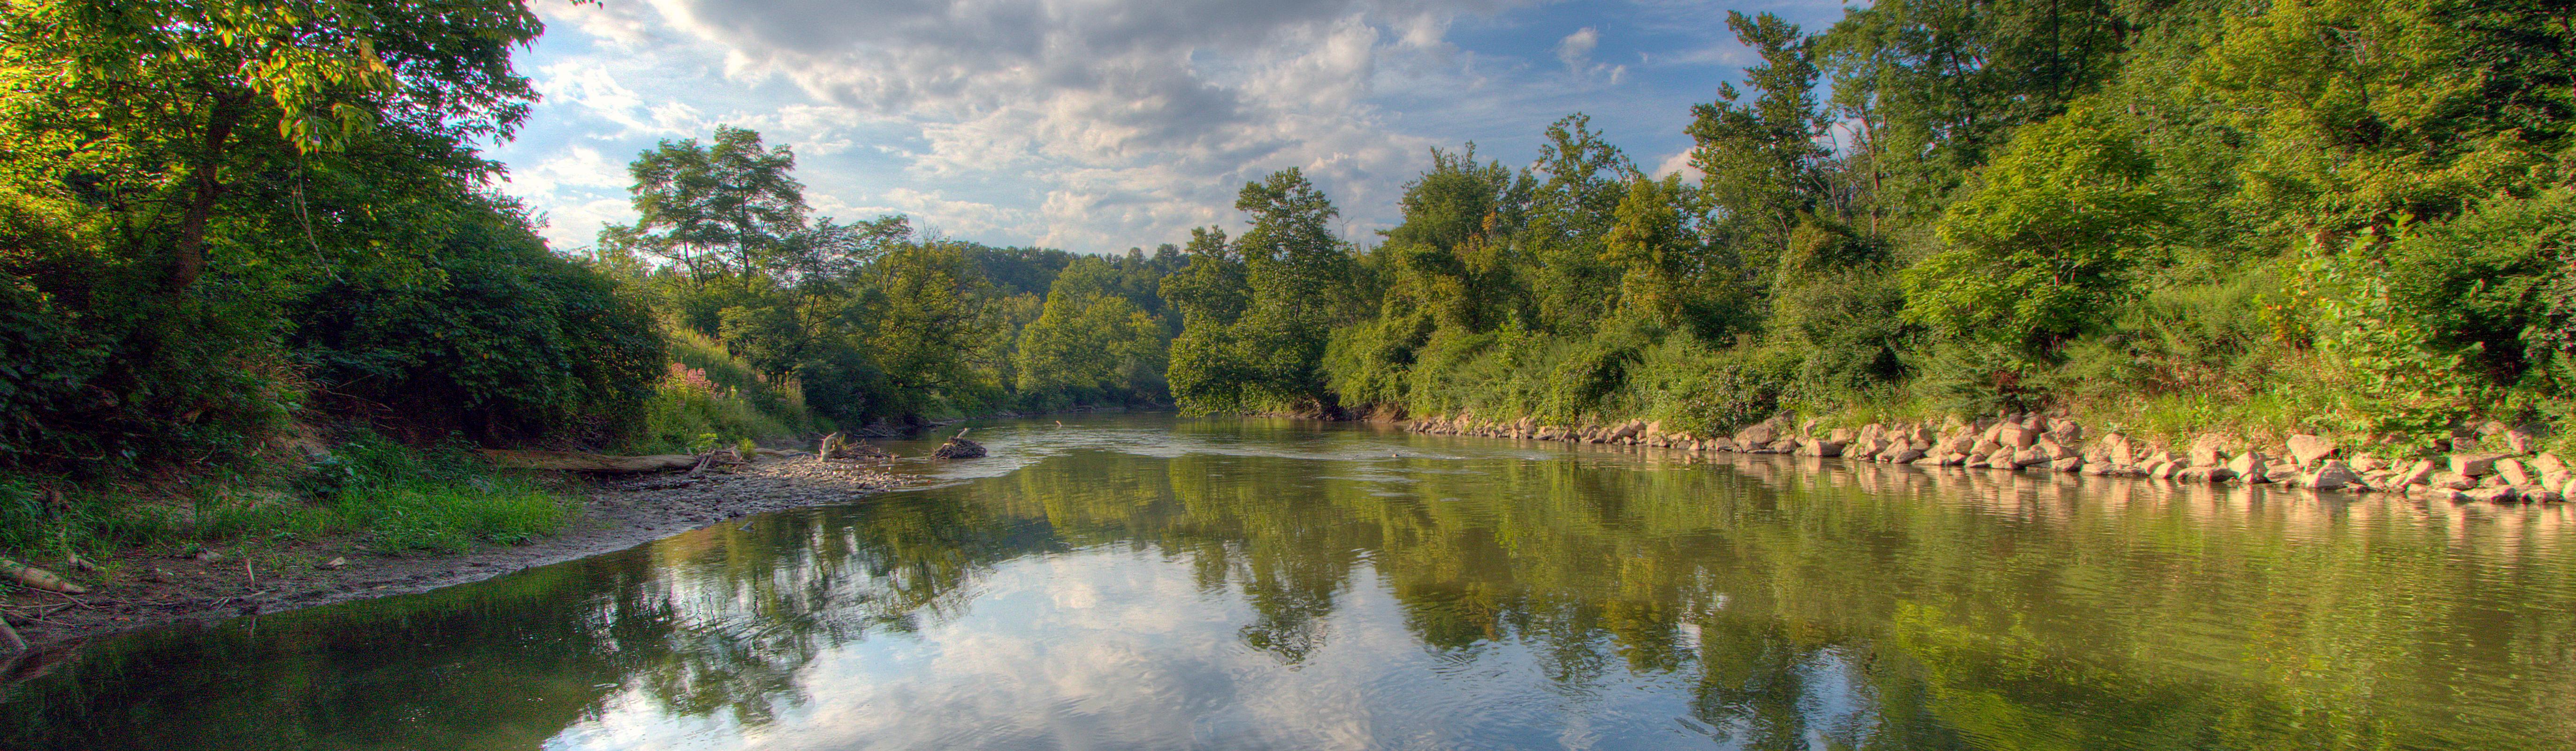
Cuyahoga Valley National Park protects forests, farms, waterfalls and a river corridor between Cleveland and Akron.
Sources: Census · population · Census · area
Northern cardinal
Sources: Designation & background
Beautiful Ohio
Sources: Designation & background
Neighboring states: Indiana, Kentucky, Michigan, Pennsylvania, West Virginia.
Cuyahoga Valley National Park protects forests, farms, waterfalls and a river corridor between Cleveland and Akron. The Ohio & Erie Canal Towpath also preserves evidence of an earlier transportation system.
The total area includes 105,829 km² of land and 10,269 km² of water, according to Census area measurements.
A swallowtail design with red-and-white stripes, a blue triangle, stars and a red-and-white circular emblem.
Sources: Census · geographic reference · Census · area measurements · National Park Service · Cuyahoga Valley
Cuyahoga Valley lies between Cleveland and Akron and includes woods, farms, waterfalls, and a river corridor. Its canal towpath records an earlier transportation network within the same landscape. A protected area near cities can contain both ecological recovery and industrial history. It need not be remote to reveal important relationships between people and water.
Industrial pollution left oil and debris in the Cuyahoga River near Cleveland. The river had caught fire before 1969, so that year’s fire was not the first or the largest. Its significance came from the public attention it received during a growing movement for environmental protection.
The fire became a symbol of polluted waterways and helped build support for stronger action. Water-quality agreements, federal legislation and local cleanup efforts followed. The river’s recovery took sustained work over many years. Saying that one fire alone created environmental law would overlook the organizing, earlier reforms and continuing cleanup that also mattered.
Read more: Historical source ↗
The 1969 Cuyahoga River fire became a symbol of industrial pollution, but it was not the river’s first fire or the only cause of environmental reform. Public concern, organizing, and policy changes extended beyond one incident. A memorable event can focus attention on a long-standing problem without having created that problem itself.
Sources: Congressional Research Service · statehood · U.S. Census Bureau · historical geography · National Park Service
The Shawnee Tribe’s history includes Ohio and a wider eastern region, while its present government is based in Oklahoma. These connections illustrate how displacement can separate current institutions from ancestral places.
Continue with Shawnee Tribe. This is one starting point, not a complete account of the peoples connected to this land.
| Measure | Ohio | Indiana |
|---|---|---|
| Population (2025) | 11,900,510 | 6,973,333 |
| Land area (km²) | 105,829 | 92,789 |
| People per km² of land | 112.5 | 75.2 |
Ohio has more people per square kilometer of land. Population density divides population by land area. It is an average across the whole jurisdiction, not a claim that residents are evenly spread out.
Calculated from the Census population series and land-area measurements used on these pages. Rounded figures; water area is excluded. Explore Indiana.
In 2025, manufacturing was the largest of the broad industry groups compared here by current-dollar output. Other major groups included real estate and rental and leasing, professional and business services, and finance and insurance.
Total economic output was $966.8 billion in current dollars in 2025.
Share of total current-dollar GDP. These figures measure output, not employment.
Sources: BEA · annual GDP by state, SAGDP2
The industry chart measures the value of production. It does not count workers. An industry with a large share of GDP need not employ the most people or pay the highest wages. Employment and wage data would be needed to answer those questions.
July 1 resident population estimates, using the Census Bureau’s Vintage 2025 series.
Sources: U.S. Census Bureau
| Year | People |
|---|---|
| 2020 | 11,798,534 |
| 2021 | 11,761,443 |
| 2022 | 11,764,950 |
| 2023 | 11,808,390 |
| 2024 | 11,860,621 |
| 2025 | 11,900,510 |
Real GDP measures economic output adjusted for inflation. The chart uses BEA’s chained 2017 dollars.
Sources: U.S. Bureau of Economic Analysis
| Year | Millions of chained 2017 dollars |
|---|---|
| 2010 | 563,816.3 |
| 2011 | 580,251.4 |
| 2012 | 586,540.9 |
| 2013 | 603,057.4 |
| 2014 | 624,973.4 |
| 2015 | 633,274.8 |
| 2016 | 638,157.5 |
| 2017 | 652,187.5 |
| 2018 | 656,212.0 |
| 2019 | 674,063.9 |
| 2020 | 655,730.1 |
| 2021 | 691,630.0 |
| 2022 | 694,473.4 |
| 2023 | 707,996.2 |
| 2024 | 721,997.3 |
| 2025 | 734,365.1 |
Ohio’s population increased by about 0.9% between 2020 and 2025 in this series. That shows the size of the change. The chart alone cannot tell us how much came from births, deaths or migration.
Real GDP adjusts for changes in prices, so it helps compare production over time. Current-dollar GDP includes price changes. Neither measure tells us how income is distributed among residents.
Electoral votes equal the state’s U.S. House seats plus its two U.S. Senate seats. These allocations apply to the 2024 and 2028 presidential elections.
Use the explanations and data on this page to answer ten questions. Hints and links to the relevant sections are available throughout.
Your place in the quiz and best full-quiz score are saved on this device when browser storage is available.
Want to practice recognizing states? Try the mixed-state map quiz.
Narrative and quiz updated 5 October 2026. Statistical data prepared 27 September 2026. Population: Census Bureau Vintage 2025, July 1 estimates for 2020–2025. Real GDP: BEA annual state accounts, SAGDP9, millions of chained 2017 dollars; industry shares: SAGDP2, current dollars. Data downloaded 27 September 2026. Area measurements include land and water.
Sources: Census · population estimates · BEA · state GDP · Census · area measurements · Natural Earth · map data
The capital clock shows current local time. Statistical figures are dated estimates and may be revised.
Updated 29 October 2026. Statistics retain the dated series shown in the charts; these are not live figures. Sources are linked beside each topic.