
State bird
Lark bunting
Sources: Designation & background

The Centennial State
Explore how Colorado’s mountains shape its water, how the gold rush changed its government and communities, and what its landscapes reveal about its history.
UT = Utah · WY = Wyoming · NE = Nebraska · KS = Kansas · OK = Oklahoma · NM = New Mexico · AZ = Arizona. Arizona meets Colorado at a single point, Four Corners.
Sources: Census · population · Census · area
Lark bunting
Sources: Designation & background
Where the Columbines Grow; Rocky Mountain High
Sources: Designation & background
Colorado is not all mountains. Its three broad landscapes help explain why climate, vegetation, and livelihoods change across the state.
Elevated plateaus, mesas, and river-cut canyons occupy much of western Colorado. A mesa is an elevated area with a flat top and steep sides.
High ridges and valleys interrupt the movement of air. Rising air cools, helping produce rain or snow; descending air can leave nearby areas much drier.
The plains extend eastward toward Kansas and Nebraska. They rise gradually toward the mountains, so “plains” does not mean low elevation.
West-to-east schematic, not a topographic map. Colorado State University: climate and terrain.
Higher terrain is generally cooler than lower terrain nearby. Mountain slopes also change how air moves and where moisture falls. A weather report for Denver therefore cannot describe conditions on a high mountain pass. Elevation, exposure, and the season all matter.
Winter snow accumulates in the mountains and releases water as it melts. That runoff supplies rivers and supports communities, irrigation, and ecosystems beyond the mountain slopes. A watershed is the area that drains toward a shared river or outlet.
The Continental Divide separates drainage flowing toward the Pacific side of North America from drainage flowing toward the Atlantic side, including the Gulf of Mexico. It is a drainage boundary, not Colorado’s state border. Water on different sides can begin only a short distance apart yet follow very different routes downstream.
National Park Service: Continental Divide · Colorado State University
Local rainfall is only part of its water supply. Snowmelt can reach the valley through rivers and water systems. Conditions upstream can therefore matter even when the valley itself receives little snow.
Gold discoveries in 1858 drew prospectors to the area around Denver and the Rocky Mountain foothills. The rush brought more than miners: growing settlements needed merchants, transport, food, and government. Settlers wanted institutions that could manage their expanding towns and competing claims.
These were already Indigenous homelands. Ute peoples lived across the mountains and western country, while Cheyenne and Arapaho communities used the plains. The arrival of miners and settlers put pressure on land and resources that Native communities depended on. Creating a territory did not mean the land had previously been empty.
Colorado State Government History · National Archives: the pressures preceding Sand Creek · Southern Ute Indian Tribe
Congress established Colorado Territory on February 28, 1861, combining land previously administered within Kansas, Nebraska, New Mexico, and Utah territories. This created a territorial government within essentially the present state boundaries. It did not make Colorado a state. Statehood, with voting representation in Congress, came fifteen years later.
Census: Colorado’s changing jurisdiction · U.S. Senate: territory and statehood
On November 29, 1864, Colorado volunteer soldiers led by Colonel John Chivington attacked a Cheyenne and Arapaho village at Sand Creek. People under Black Kettle’s leadership believed they were at peace with the United States and under its protection. Many of those killed were women and children.
This was a massacre, not a battle between two comparable armies. Three federal investigations condemned the attack. It devastated families and damaged relations between the United States and Cheyenne and Arapaho communities. Colorado’s growth cannot be understood only as a story of new towns and prosperity; it also involved violence and dispossession.
National Park Service: Sand Creek · National Archives: attack and investigations
In 1875, Congress authorized the process of drafting a state constitution. President Ulysses S. Grant admitted Colorado as the 38th state on August 1, 1876. The nickname refers to that year being 100 years after the Declaration of Independence in 1776. It does not mean Colorado became a state on July 4.
The Southern Ute Indian Tribe, headquartered in Ignacio, and the Ute Mountain Ute Tribe, headquartered in Towaoc, remain sovereign tribal nations in southwestern Colorado. Their history does not end with settlement or statehood.
The Southern Ute Tribe describes how the 1873 Brunot Agreement reduced Ute lands after mineral discoveries in the San Juan Mountains. Loss of land also meant loss of access to seasonal camps and hunting areas. A 2009 agreement with Colorado reaffirmed hunting and fishing rights in the Brunot area, illustrating how historical agreements still affect life today.
These Ute histories are distinct from those of the Cheyenne and Arapaho peoples discussed at Sand Creek and from the Ancestral Pueblo communities associated with Mesa Verde. “Indigenous history” is not a single interchangeable story.
Read the Southern Ute Indian Tribe’s account · Ute Mountain Ute Tribe
Select a detail to see its documented explanation.
The C identifies Colorado. A legislative visitor guide also connects its red color with the state’s mineral-rich red soil.
The legislature’s guide connects gold with Colorado’s sunshine.
The guide connects white with snow-covered mountains.
The guide connects blue with Colorado’s blue skies.
Andrew Carlisle Johnson designed the flag adopted in 1911. These explanations follow the Colorado legislature’s visitor guide; they are not new interpretations invented for this lesson.
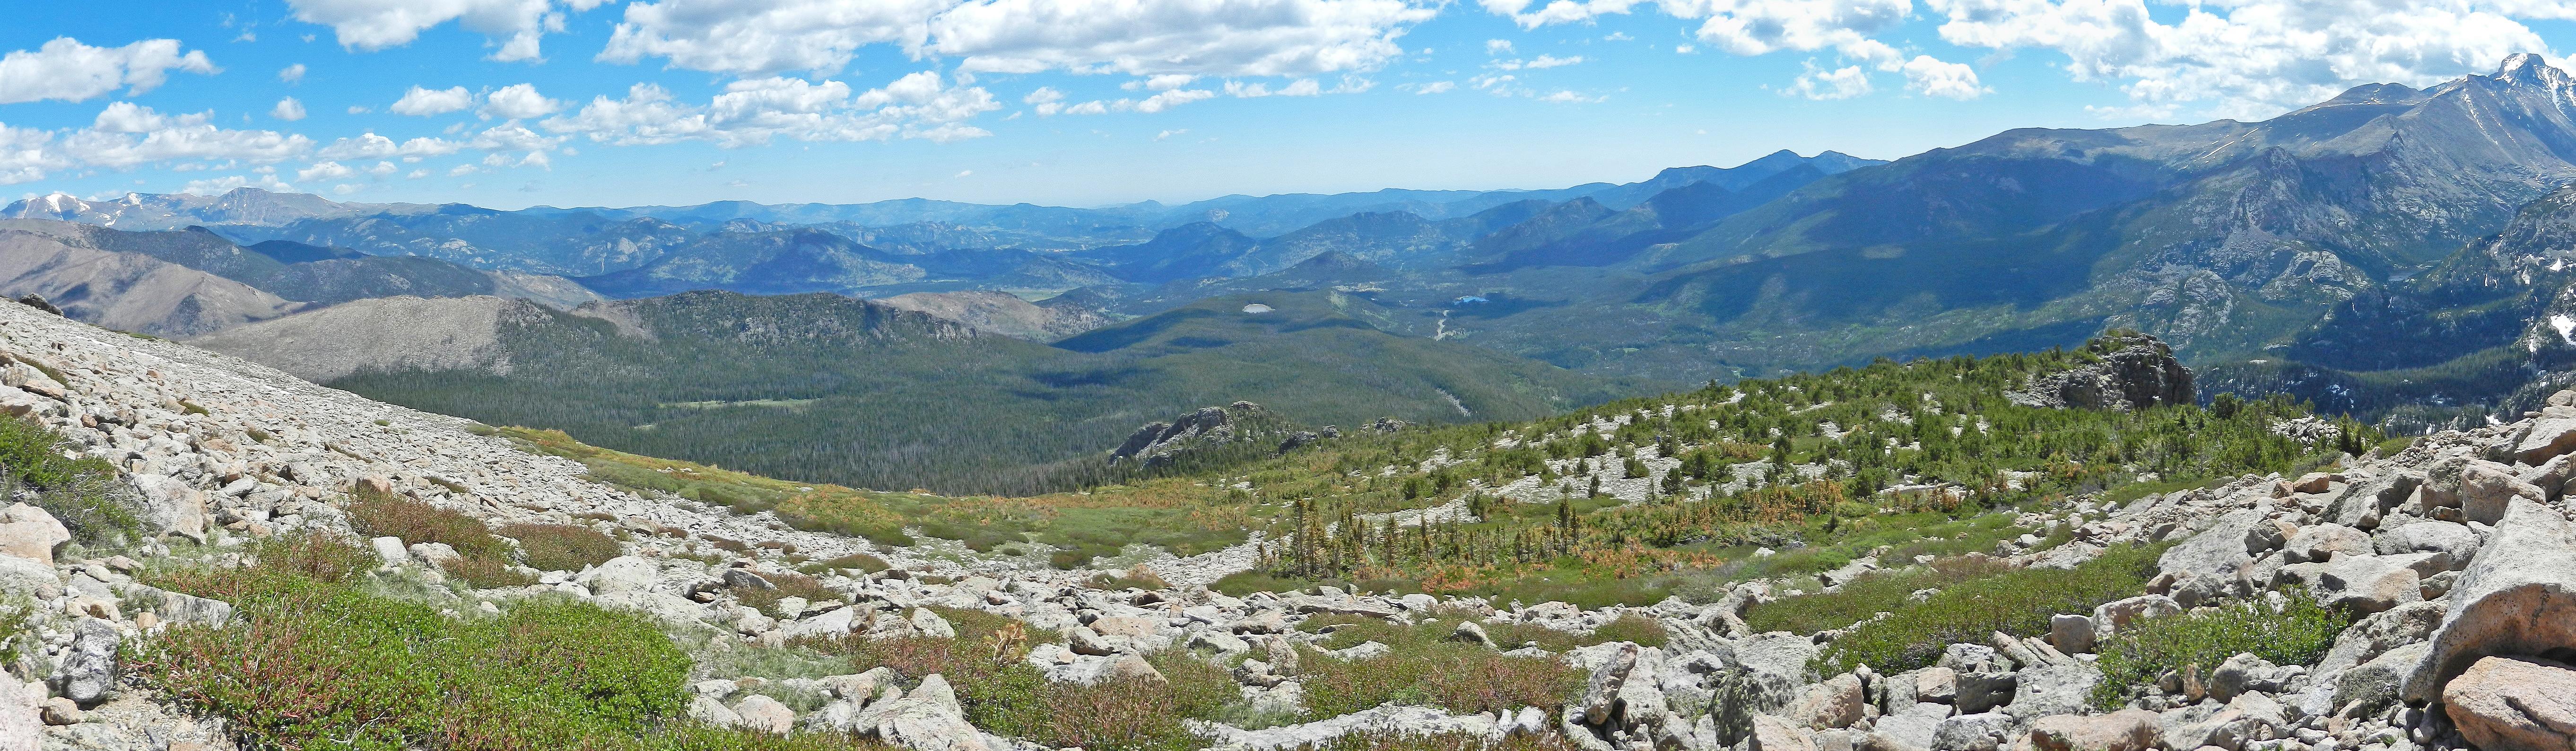
Use these places to connect physical processes and human history to the landscape.
National Park Service
Meadows and forests give way to subalpine lakes and alpine terrain. The change with elevation makes the park a useful example of why one state contains very different growing conditions.
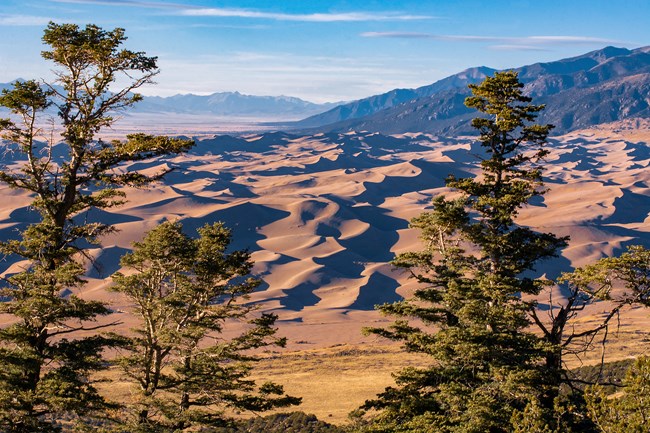 NPS / Patrick Myers
Wind moves sand into the dunefield, while creeks carry sand back toward the valley floor to be picked up again. The dunes are part of a connected system of mountains, water, and wind, not simply an isolated pile of desert sand.
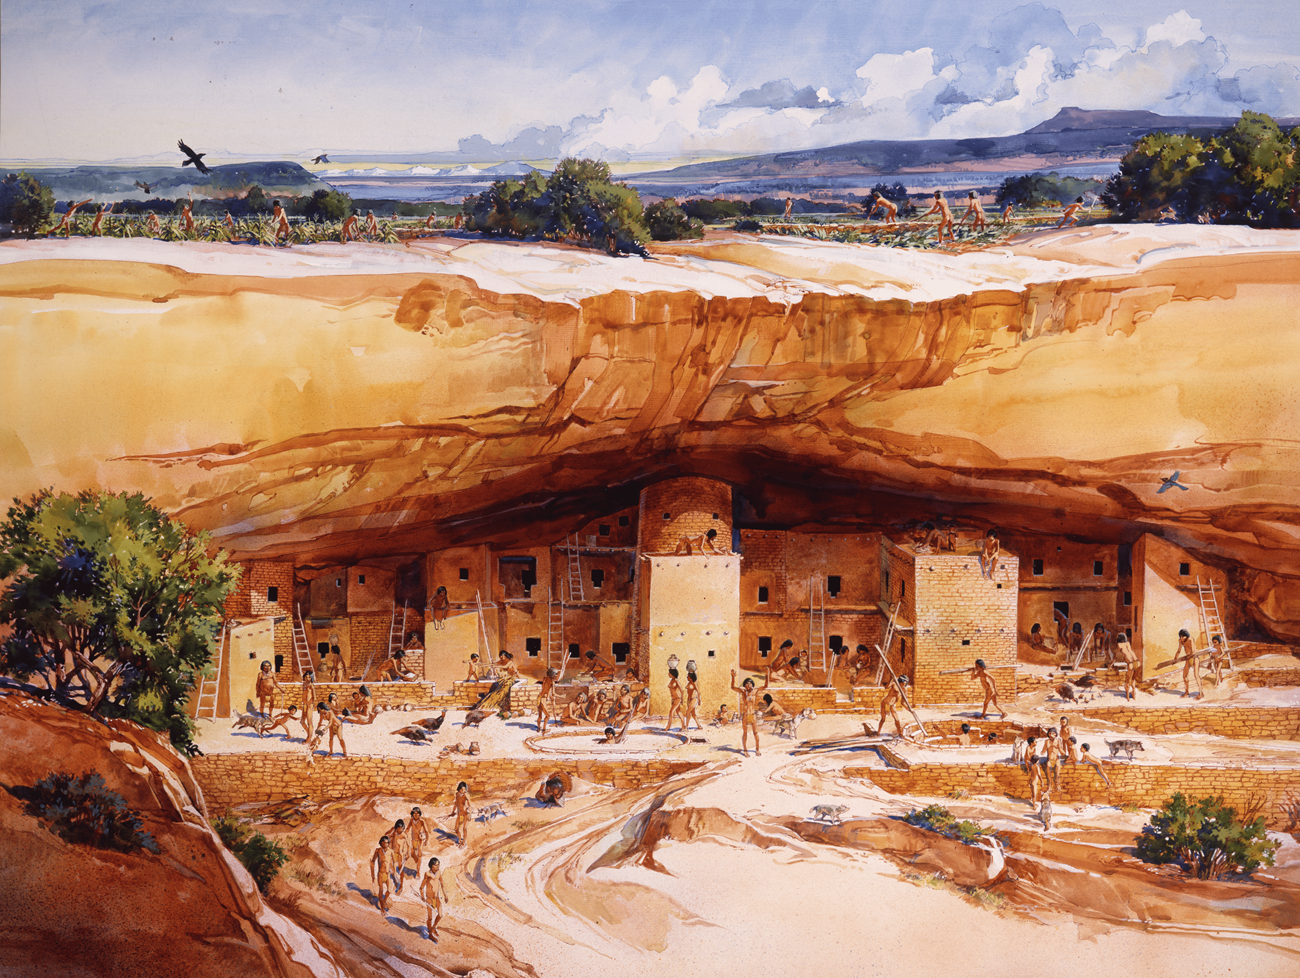 Reconstruction illustration: NPS / Roy Andersen
Ancestral Pueblo people farmed, traded, and built communities here long before Colorado statehood. People later migrated to other places; they did not simply disappear. Living Pueblo communities maintain connections with this landscape.
The High Plains continue from eastern Colorado into Kansas. Crossing a political border does not suddenly change the land into a different landscape. Conversely, traveling within Colorado from the plains into the Rockies can bring a large change in elevation and climate without crossing any state border.
This distinction is useful when comparing states: boundaries tell you who governs an area; physical regions tell you about its terrain. They answer different questions.
No. The plains continue across the Colorado–Kansas boundary, while Colorado itself contains plains, mountains, and plateaus. Political boundaries and physical regions do not necessarily coincide.
In 2025, professional and business services was the largest of the broad industry groups compared here by current-dollar output. Other major groups included real estate and rental and leasing, government and government enterprises, and educational services, health care, and social assistance.
Total economic output was $584.3 billion in current dollars in 2025.
Share of total current-dollar GDP. These figures measure output, not employment.
Sources: BEA · annual GDP by state, SAGDP2
The bars compare the value of production. A large share of GDP does not necessarily mean an industry employs the most people or pays the highest wages. Those questions require employment and wage data.
Colorado’s mining history is important, but it should not be mistaken for a description of the whole economy today. The dated chart above shows several service-sector groups among the largest contributors.
July 1 resident population estimates, using the Census Bureau’s Vintage 2025 series.
Sources: U.S. Census Bureau
| Year | People |
|---|---|
| 2020 | 5,786,873 |
| 2021 | 5,814,368 |
| 2022 | 5,853,355 |
| 2023 | 5,912,240 |
| 2024 | 5,988,502 |
| 2025 | 6,012,561 |
Real GDP measures economic output adjusted for inflation. The chart uses BEA’s chained 2017 dollars.
Sources: U.S. Bureau of Economic Analysis
| Year | Millions of chained 2017 dollars |
|---|---|
| 2010 | 279,385.6 |
| 2011 | 283,963.8 |
| 2012 | 289,339.5 |
| 2013 | 301,484.1 |
| 2014 | 315,399.0 |
| 2015 | 330,526.1 |
| 2016 | 337,685.2 |
| 2017 | 350,209.1 |
| 2018 | 365,204.5 |
| 2019 | 383,725.6 |
| 2020 | 380,544.0 |
| 2021 | 406,309.2 |
| 2022 | 422,576.1 |
| 2023 | 440,225.2 |
| 2024 | 448,838.5 |
| 2025 | 458,147.1 |
Electoral votes equal the state’s U.S. House seats plus its two U.S. Senate seats. These allocations apply to the 2024 and 2028 presidential elections.
Apply what you have read. These questions cover geography, historical causes, flag details, and how to interpret evidence.
Your place in the quiz and best full-quiz score are saved on this device when browser storage is available.
Want to practice recognizing states? Try the mixed-state map quiz.
Narrative and quiz reviewed 29 October 2026. Statistical charts retain the dated series from the existing page; they are not presented as live figures. Sources are linked beside the relevant explanations.
Narrative and quiz updated 5 October 2026. Statistical data prepared 27 September 2026. Population: Census Bureau Vintage 2025, July 1 estimates for 2020–2025. Real GDP: BEA annual state accounts, SAGDP9, millions of chained 2017 dollars; industry shares: SAGDP2, current dollars. Data downloaded 27 September 2026. Area measurements include land and water.
Sources: Census · population estimates · BEA · state GDP · Census · area measurements · Natural Earth · map data
The capital clock shows current local time. Statistical figures are dated estimates and may be revised.