
State bird
Northern mockingbird
Sources: Designation & background

The Lone Star State
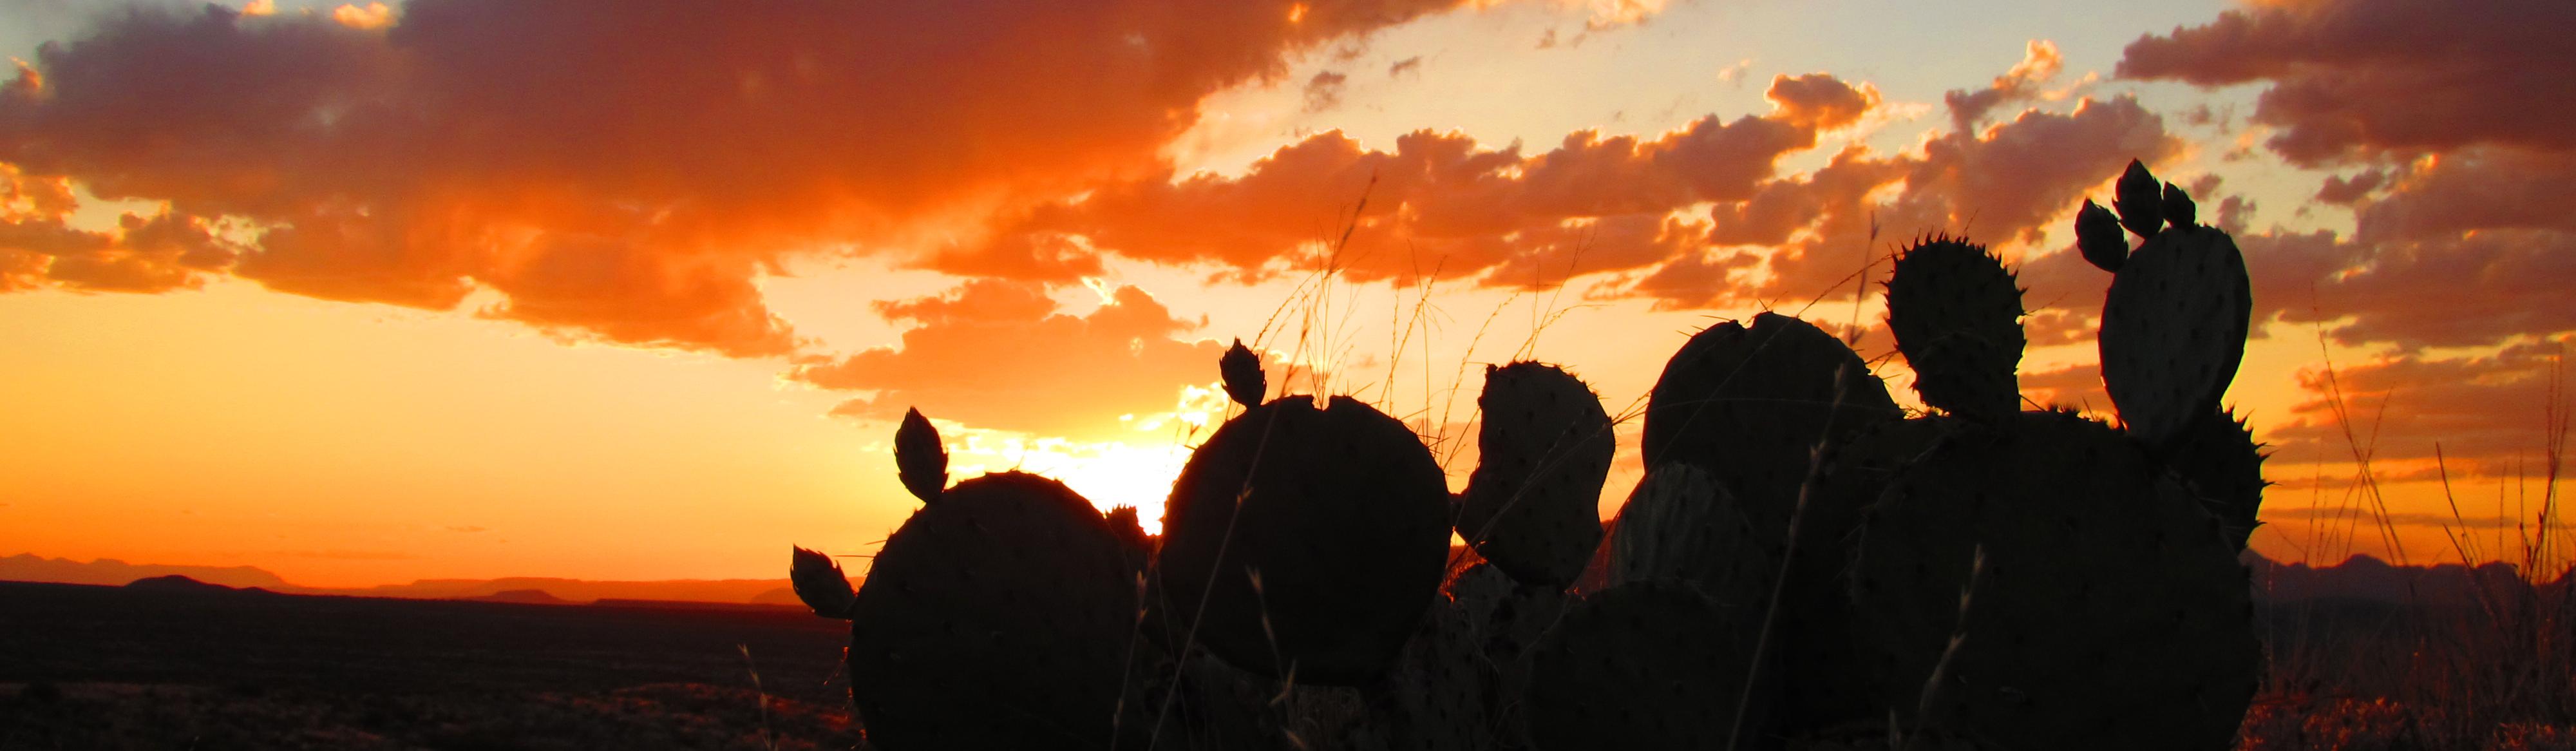
Big Bend contains Chihuahuan Desert, mountain habitats and river canyons along the Rio Grande.
Sources: Census · population · Census · area
Northern mockingbird
Sources: Designation & background
Texas, Our Texas
Sources: Designation & background
Chili
Sources: Designation & background
Neighboring states: Arkansas, Louisiana, New Mexico, Oklahoma.
Big Bend contains Chihuahuan Desert, mountain habitats and river canyons along the Rio Grande. Elevation and access to water help explain the contrast between dry lowlands, cooler mountains and the river corridor.
The total area includes 676,587 km² of land and 19,075 km² of water, according to Census area measurements.
A blue vertical band with one white star, beside white and red horizontal bands.
Sources: Census · geographic reference · Census · area measurements · National Park Service · Big Bend
Big Bend contains desert, mountain habitats, and the Rio Grande corridor. Elevation and access to water help explain why these settings differ. A river can be both an international boundary and a source of connection for habitats and communities. The political role of the Rio Grande does not replace its physical role in shaping the landscape.
Texas declared independence from Mexico in 1836 and operated as a republic. Mexico did not accept the loss of Texas, while Americans disagreed over annexation and the expansion of slavery. The United States admitted Texas as a state in December 1845.
Annexation did not settle the disputed boundary. Texas claimed the Rio Grande, while Mexico regarded the Nueces River farther north as the relevant boundary. U.S. troops moved into the disputed area, and fighting helped trigger the Mexican-American War in 1846. Texas statehood was therefore linked to an international conflict as well as the growth of the United States.
Read more: Historical source ↗
Mexico did not accept Texas’s independence, and annexation brought that unresolved dispute into U.S.–Mexican relations. The disputed boundary added another source of conflict. Explaining the war requires more than noting that Texas joined the United States in 1845: it requires identifying what each government claimed and why those claims were incompatible.
Sources: Congressional Research Service · statehood · U.S. Census Bureau · historical geography · National Park Service
The Alabama-Coushatta Tribe of Texas provides one present-day Indigenous perspective from the state. A narrative centered only on the Texas Republic, annexation, and the U.S.–Mexico boundary leaves out other peoples and political histories.
Continue with Alabama-Coushatta Tribe of Texas. This is one starting point, not a complete account of the peoples connected to this land.
| Measure | Texas | Arkansas |
|---|---|---|
| Population (2025) | 31,709,821 | 3,114,791 |
| Land area (km²) | 676,587 | 134,771 |
| People per km² of land | 46.9 | 23.1 |
Texas has more people per square kilometer of land. Population density divides population by land area. It is an average across the whole jurisdiction, not a claim that residents are evenly spread out.
Calculated from the Census population series and land-area measurements used on these pages. Rounded figures; water area is excluded. Explore Arkansas.
In 2025, real estate and rental and leasing was the largest of the broad industry groups compared here by current-dollar output. Other major groups included professional and business services, manufacturing, and government and government enterprises.
Total economic output was $2,904.4 billion in current dollars in 2025.
Share of total current-dollar GDP. These figures measure output, not employment.
Sources: BEA · annual GDP by state, SAGDP2
The industry chart measures the value of production. It does not count workers. An industry with a large share of GDP need not employ the most people or pay the highest wages. Employment and wage data would be needed to answer those questions.
July 1 resident population estimates, using the Census Bureau’s Vintage 2025 series.
Sources: U.S. Census Bureau
| Year | People |
|---|---|
| 2020 | 29,237,895 |
| 2021 | 29,572,672 |
| 2022 | 30,118,002 |
| 2023 | 30,719,247 |
| 2024 | 31,318,578 |
| 2025 | 31,709,821 |
Real GDP measures economic output adjusted for inflation. The chart uses BEA’s chained 2017 dollars.
Sources: U.S. Bureau of Economic Analysis
| Year | Millions of chained 2017 dollars |
|---|---|
| 2010 | 1,323,059.1 |
| 2011 | 1,370,174.9 |
| 2012 | 1,438,354.4 |
| 2013 | 1,511,806.5 |
| 2014 | 1,559,636.1 |
| 2015 | 1,634,127.1 |
| 2016 | 1,633,863.3 |
| 2017 | 1,667,313.0 |
| 2018 | 1,746,543.3 |
| 2019 | 1,806,736.1 |
| 2020 | 1,782,738.2 |
| 2021 | 1,905,512.4 |
| 2022 | 1,975,164.0 |
| 2023 | 2,137,536.7 |
| 2024 | 2,221,943.3 |
| 2025 | 2,277,203.3 |
Texas’s population increased by about 8.5% between 2020 and 2025 in this series. That shows the size of the change. The chart alone cannot tell us how much came from births, deaths or migration.
Real GDP adjusts for changes in prices, so it helps compare production over time. Current-dollar GDP includes price changes. Neither measure tells us how income is distributed among residents.
Electoral votes equal the state’s U.S. House seats plus its two U.S. Senate seats. These allocations apply to the 2024 and 2028 presidential elections.
Use the explanations and data on this page to answer ten questions. Hints and links to the relevant sections are available throughout.
Your place in the quiz and best full-quiz score are saved on this device when browser storage is available.
Want to practice recognizing states? Try the mixed-state map quiz.
Narrative and quiz updated 5 October 2026. Statistical data prepared 27 September 2026. Population: Census Bureau Vintage 2025, July 1 estimates for 2020–2025. Real GDP: BEA annual state accounts, SAGDP9, millions of chained 2017 dollars; industry shares: SAGDP2, current dollars. Data downloaded 27 September 2026. Area measurements include land and water.
Sources: Census · population estimates · BEA · state GDP · Census · area measurements · Natural Earth · map data
The capital clock shows current local time. Statistical figures are dated estimates and may be revised.
Updated 29 October 2026. Statistics retain the dated series shown in the charts; these are not live figures. Sources are linked beside each topic.